
Fig 4.
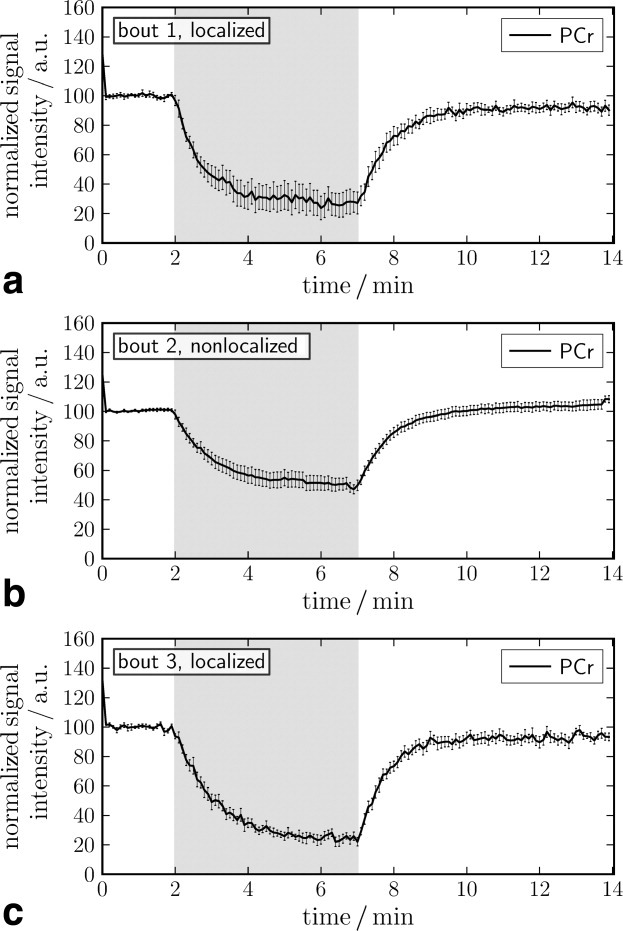
Time courses of PCr signal intensity from three exercise bouts of equal intensity measured with (a), without (b), and with (c) 31P MRS localization to gastrocnemius medialis muscle. Data represent mean ± standard error of the mean (SE) over seven subjects exercising at 50% MVC and are normalized to resting PCr signal intensity. The exercise period is indicated in gray.