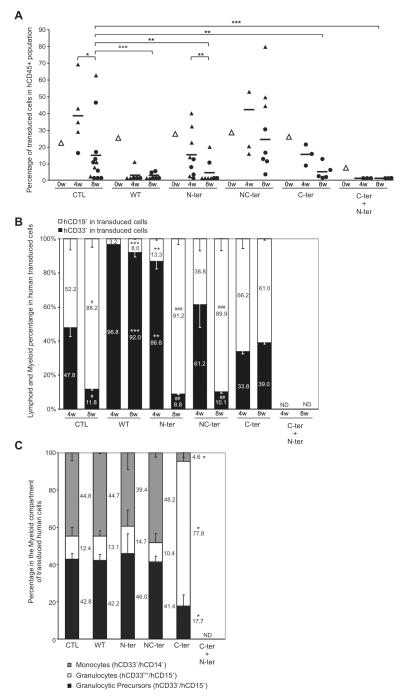
Figure 6. WT and mutants C/EBPα Engraftment in Immunodeficient Mice.
(A) In vivo kinetic of transduced cells in Human Hematopoietic population. Sub-lethally irradiated NOD/SCID/β2 microglobulin null mice (NOD/SCID/β2) were transplanted with Human Lin- cells after transduction. Percent of Transduced cells in human engraftment was analyzed at different time points by FACS. Transduction efficiency of transplanted populations (white triangle), mean of transduced cells percentage at different time points (black dash) and transduced cells percentage of individual mice (black triangle or circle) are shown. Animal analyzed at 4 or 8 weeks by bone marrow aspirations are identified by black triangles; circles indicated that the mice have been culled first and bone marrow cells flushed for the analysis. Data from two independent experiments are shown. (B) Hematopoietic lineage analysis of transduced cells in vivo at different time points. Bar graph showing percent of Lymphoid (hCD19+, white bars) and Myeloid (hCD33+, black bars) transduced cells. Numbers represent Myeloid-Lymphoid ratio in transduced human cells. (C) Percentage of transduced monocytes, granulocytes and granulocyte precursors present in the myeloid compartment of engrafted mice 8 weeks post-transplant. Numbers represent the ratio of each fraction in transduced human cells. Results are shown as mean ± SD. Data from four independent experiments are shown. Significant differences of p ≤ 0.05, p ≤ 0.01 or p ≤ 0.001 are indicating by (*), (**) or (***) respectively. ND, not detected.

