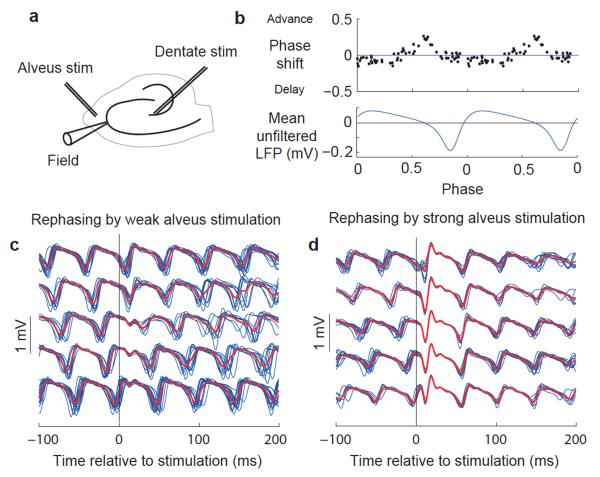
Figure 1.
Measurement of network PRCs in the hippocampal CA3 subfield. (a) Schematic indicating positions of recording and stimulating electrodes. (b) PRC with weak stimulation, aligned with average unfiltered LFP over two cycles. (c) Filtered LFP traces (blue) around weak alveus stimulation in a representative experiment, sorted into five groups by phase of stimulation with group averages superimposed (red). (d) Data obtained and plotted as in c, but with strong alveus stimulation.

