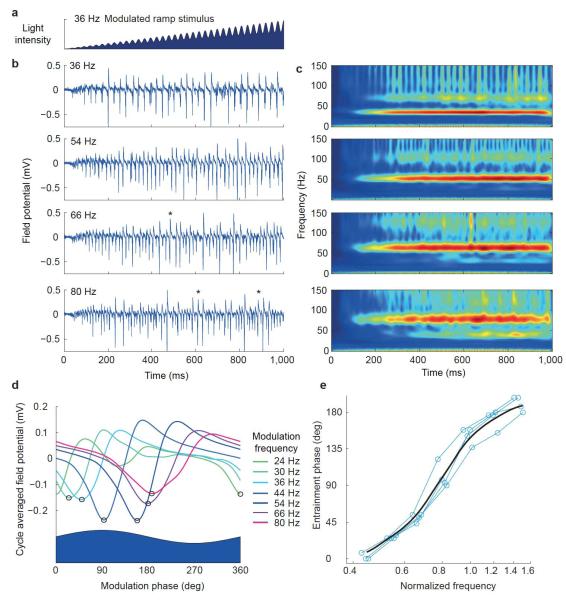
Figure 6.
Entrainment demonstrated with modulated light ramps. (a) Example of modulated ramp stimulus light intensity. (b) Example LFP traces elicited by modulated ramp stimuli at a range of modulation frequencies (frequency indicated by each panel). Asterisks indicate cycles with 1:2 entrainment. (c) Corresponding average wavelet transform amplitudes (n = 4). (d) Example average LFP responses as a function of phase of the sinusoidally modulated stimulus, for a range of frequencies indicated by trace color. Black circles indicate troughs used to evaluate entrainment phase. (e) Entrainment phase plotted as function of normalized modulation frequency; blue lines show individual slice data and black curve shows Gaussian weighted moving average.

