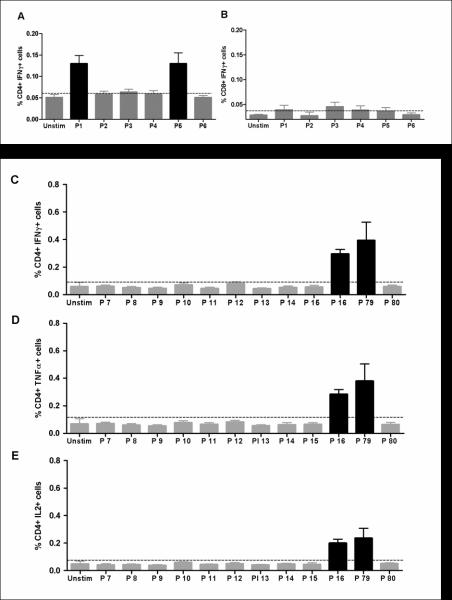
Figure 2. Identification of splenic T cell responses to AMA1 following AdHu5-MVA PcAMA1 immunization.
Mice were immunized with the same regimen as Figure 1. Two weeks post-boost (day 70), splenocytes were isolated and re-stimulated with pools of over-lapping peptides (P1 to P6, see Table 1) or no peptide (Unstim). Cells were surface stained for CD4 and CD8, and intracellularly stained for IFN-γ and assessed by flow cytometry to determine the % of responding cells per total (A) CD4+ or (B) CD8+ T cell subset. The bars represent the mean response ± SEM (n=5). In a repeat experiment, splenocytes were re-stimulated with individual peptides from Pool 1 (P7 to P16), Pool 5 (P79 and P80) or no peptide (Unstim). Cells were surface stained for CD4 and intracellularly stained for (C) IFN-γ, (D) TNFα and (E) IL-2, and assessed by flow cytometry to determine % of responding cells per total CD4+ T cell subset. The bars represent the mean response ± SEM (n=5).

