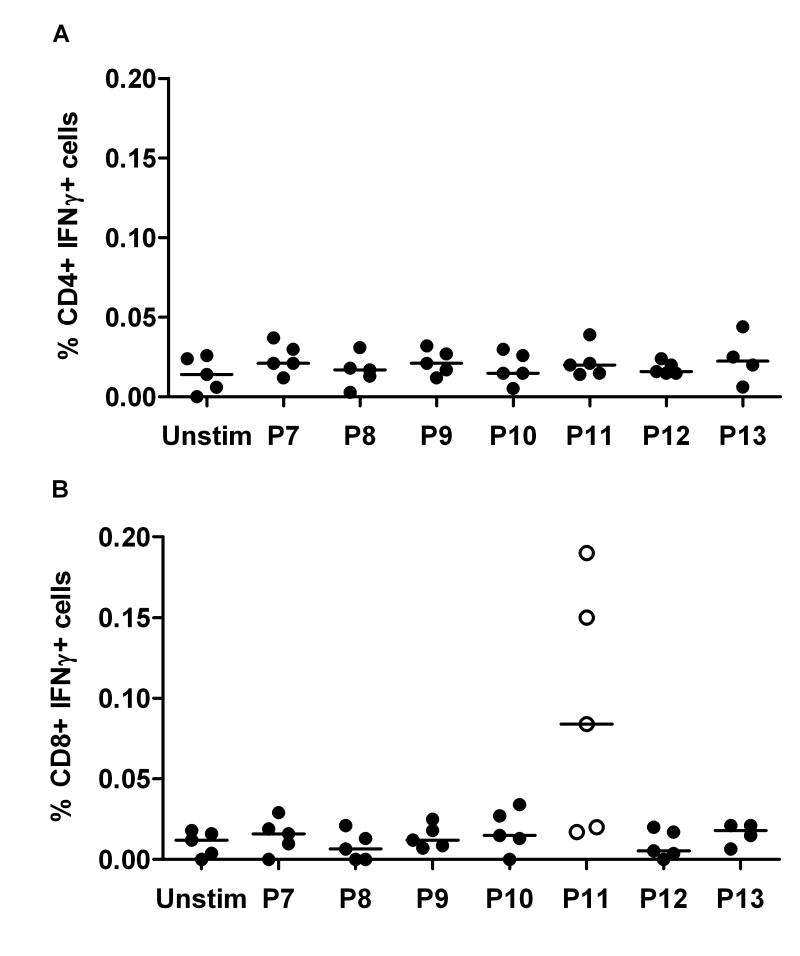
Figure 3. T cell epitope mapping within the entire ectodomain of PccAS AMA1.
Mice were immunized with the same reigmen as Figure 1. Two weeks post-boost (day 70), splenocytes were re-stimulated for 5h with seven overlapping peptide pools containing 10 peptides each (Pool 7 to Pool 13, see Table S1) or no peptide (Unstim). The cells were then surface stained for CD4 or CD8 and intracellularly for IFN-γ. The figure shows the % of (A) CD4+ IFN-γ+ cells or (B) CD8+ IFN-γ+ cells. Responses from individual mice are shown and the lines represent the median.

