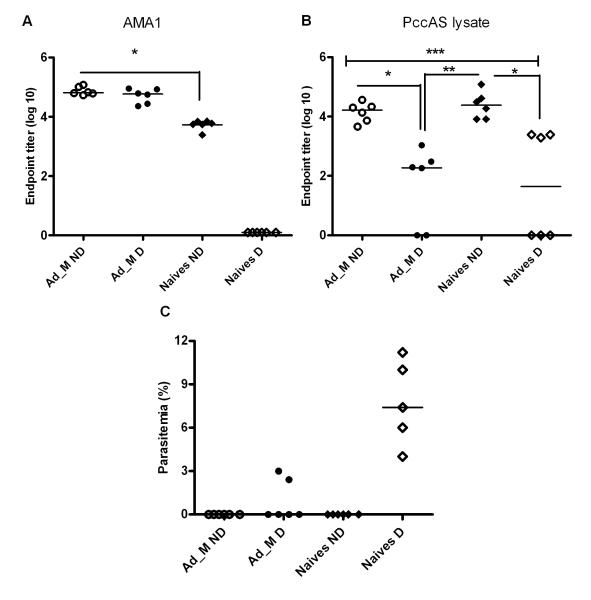
Figure 7. PcAMA1- and parasite-specific antibody responses post-challenge.
Total IgG serum antibody levels in the mice shown in Figure 6 were analyzed by ELISA one month post-challenge (day 33). Individual responses plus the median are shown for (A) PccAS AMA1 ectodomain and (B) whole PccAS parasite lysate. Significant differences in antibody levels between the different groups are indicated (ANOVA * P ≤ 0.05, ** P ≤ 0.01**, and *** P ≤ 0.001). (C) The corresponding individual and median % parasitemias in the different groups on day 33 is shown.

