
Figure 4. Association between C-mut and -35 SNP.
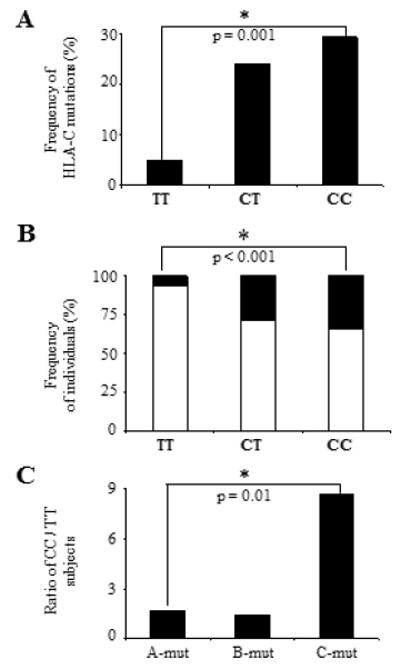
(A) Increased frequency of C-mut in presence of the CC genotype. Subjects were categorised in three groups based on their genotype at -35 (TT, CT and CC). The total numbers of C-mut in each group were counted and the frequencies were calculated based on numbers listed in Table 1 (some subjects showed more than one C-mut). (B) Distribution of -35 SNP in the cohort. Frequencies of subject with C-mut are shown in black and frequencies of individuals not exhibiting C-mut (rest of the cohort) are shown in white (Table 1). The likelihood to show C-mut is five times higher in ‘CC’ than in ‘TT’ subjects (black). (C) CC subjects exhibit an increased frequency of substitutions in HIV pro DNA associated with HLA-C but not with HLA-A or –B alleles. Ratios of subjects with the CC genotype versus individuals with the TT genotype are shown for each HLA Class I association. Statistical analyses were performed using a chi-square test using numbers from Table 1. In C, the p-value applies to a comparison between the numbers of CC versus TT subjects with A-mut, B-mut or C-mut.