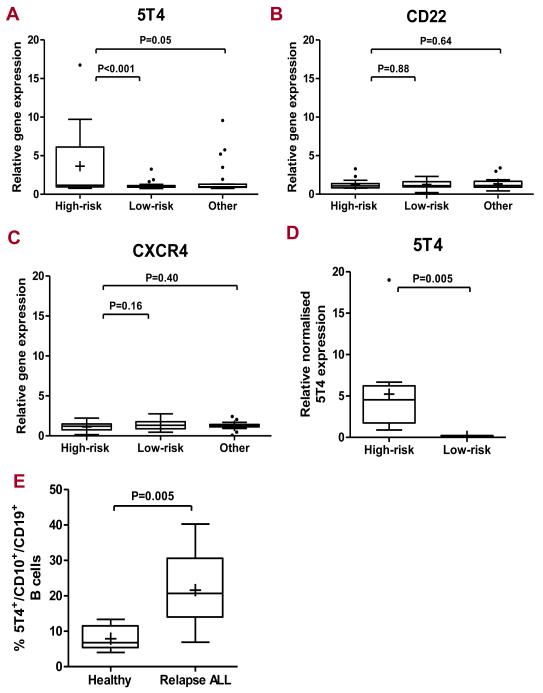
Figure 1. Leukemic cells from patients in high-risk cytogenetic subset of childhood pre-B-ALL and refractory disease express high levels of 5T4 mRNA and protein.
Box-plot representation of relative 5T4 (A), CD22 (B) and CXCR4 (C) microarray expression in leukemic blasts in high risk (n = 20), low risk (n = 43) and other (n = 22) patient groups. The y-axis represents the relative gene expression levels of either 5T4, CD22 or CXCR4. Box plots represent the interquartile range of values, the whiskers represent the smallest and largest values for each category, and the horizontal lines and cross symbols denote the median and mean respectively; outlier values are represented by asterisks; One-way ANOVA statistical analysis. (D) Box-plot representation of 5T4 quantification in high and low risk subsets in TaqMan Q-PCR assay; representation as in (C); Student-t test analysis. (E) Flow cytometry on CD19+ CD10+ B cell blasts from patients with multiple relapse disease (n = 8: 2 normal karyotype, 1 haploid, 1 hyperdiploid,1 hypodiploid, 1 ETV6-RUNX1 and 2 unknown) in comparison to healthy donors (n = 6); the y-axis represents the percentage of 5T4 positive CD19 CD10 B cells (% of 5T4 labelled samples – background). The Pre-B-ALL patients with relapse disease showed significantly higher proportions of 5T4 positive CD10+ CD19+ B blasts compared with healthy donors (means = 21.6 vs 7.9 respectively; p < 0.01, student-t test analysis.

