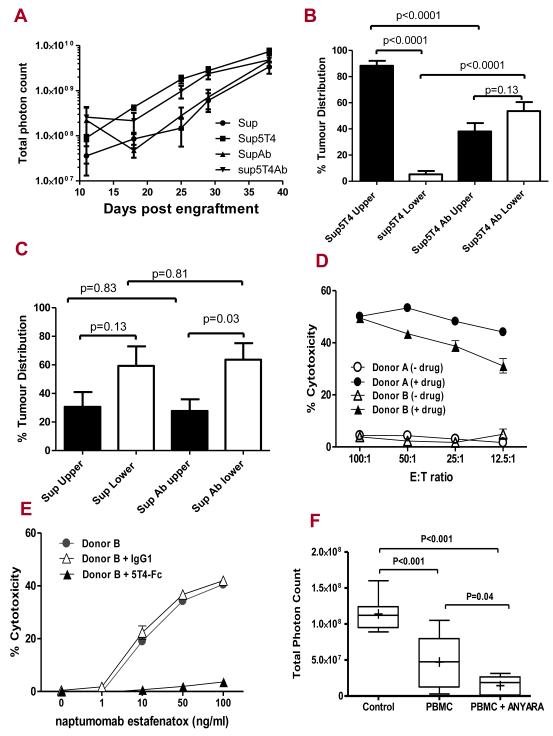
Figure 7. In vivo mAb-h5T4 treatment alters Sup5T4 but not Sup ip tumour targeting and 5T4 specific superantigen therapy of pre-B-ALL.
(A) Growth of Sup (4×10⁶) or Sup5T4 (2×10⁶) ip with or without 2/week treatment with mAb-h5T4. mAb-h5T4 treatment does not significantly alter the growth of either tumour; at day 25, Sup v Sup + mAb (p=0.46) and Sup5T4 v Sup5T4 + mAb (p=0.11). The mAb-h5T4 treatment, (B) significantly changes the pattern of dissemination of Sup5T4 cells to that of the Sup cells; (C) does not significantly change the pattern of dissemination of Sup cells. (D) Chromium release cytotoxicity of Sup-B15 cells at different effector to target (E:T) ratios of human donor PMBC (activated with SEA 100ng/ml for 5 days) requires 5T4-superantigen fusion protein (100ng/ml). Drug alone gave spontaneous release similar to the medium. (E) Killing of Sup-B15 cells at (25:1) E:T ratio with increasing concentration of naptumomab estafenatox is blocked by 5T4hIgFc (500 ng/ml) and not by IgG1(500 ng/ml). (F) In vivo therapy of Sup5T4 cells at day 27: naptumomab estafenatox with activated PBMC treatment gives significant reduction in tumour burden compared to activated PBMC treated animals or untreated mice. Box plots represent the interquartile range of values, the whiskers represent the smallest and largest values for each category, and the horizontal lines and cross symbols denote the median and mean respectively.

