
Fig. 2.
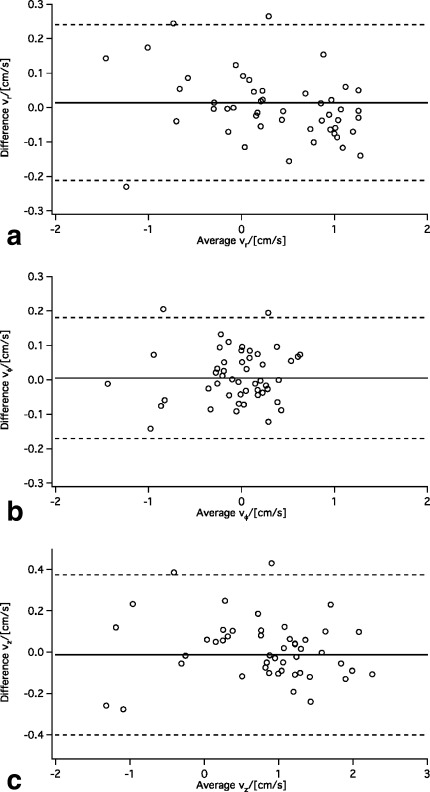
Bland–Altman plots for (a) radial, (b) tangential, and (c) longitudinal velocities, obtained in repeated measurements in a mid-ventricular slice with black-blood contrast (n = 3). The solid line represents the bias, the dashed lines ±2 SD confidence interval.