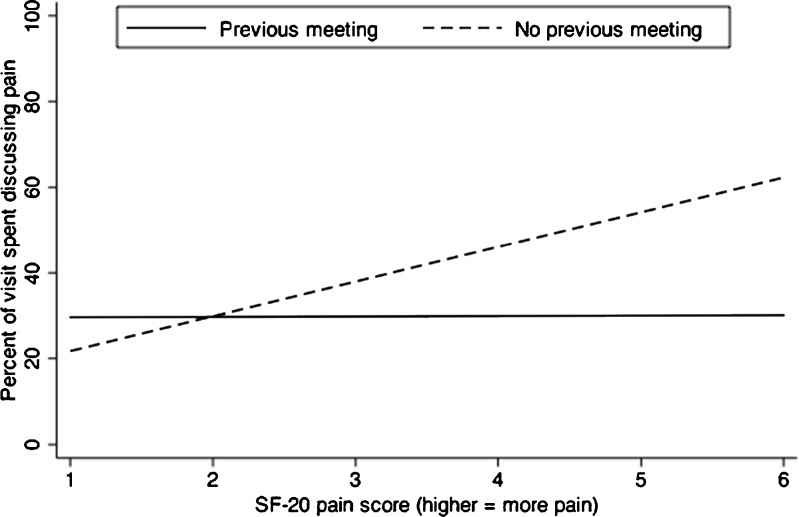
Figure 1.
Relationship between SF-20 pain score and percent of total visit time spent discussing pain. Lines represent predicted values from multiple linear regression. For visits in which the patient and physician had not met previously (dashed line), pain severity was positively associated with the percent of total visit time spent discussing pain. For visits in which the patient and physician had met previously (solid line), the percent of total visit time spent discussing pain was independent of pain severity.

