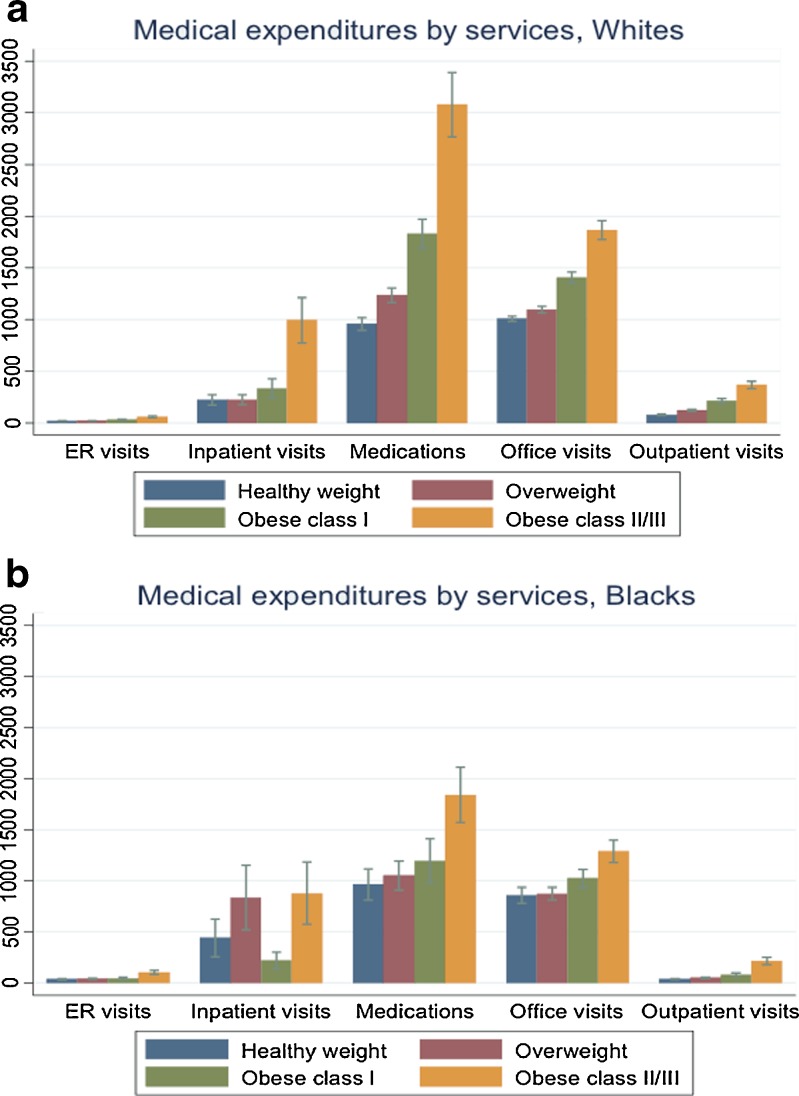
Figure 1.
a & b Estimated medical expenditures by services, whites vs. blacks. Note: Bars in the figures represent the average adjusted medical expenditures by services and race (based on the results presented in Table 4). The error bars represent the 95% confidence intervals.

