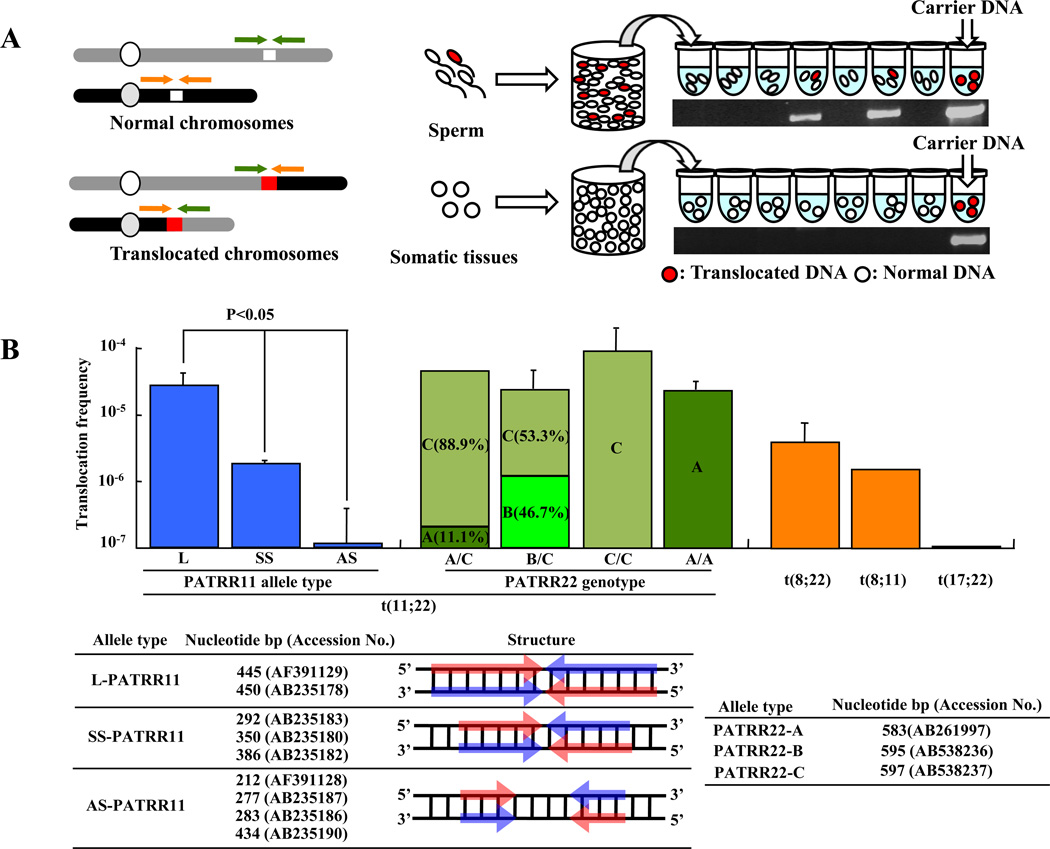
Figure 4. Detection of de novo translocations by PCR of sperm DNA.
(A) Diagram of the strategy used for estimation of translocation frequency by PCR. The green and orange arrowheads indicate the location of each individual PCR primer. White chromosomal regions indicate PATRR at the breakpoint; red chromosomal regions indicate the presence of a translocation. Combining the forward and reverse primers from different chromosomes allows the detection of the translocated product. Genomic DNA was isolated from sperm samples. Translocation-specific PCR was performed using multiple aliquots of template DNA. The translocation frequency was calculated using the equation, q = 1 - (1 - p)1/n; with n = number of haploid genomes per aliquot, p = the probability that an aliquot sustained a translocation [32]. The gel images show representative PCR results derived from sperm and lymphoblast DNA samples. The positive control is translocation carrier DNA. (B) PATRR polymorphisms affect the de novo t(11;22) translocation frequencies. In the histogram the vertical axis indicates the de novo translocation frequency for different alleles of PATRR11 (allele type L, SS, AS) and for different genotypes of PATRR22 (allele type A, B, C) in sperm. Also shown is frequency of the t(8;22), t(8;11) and t(17;22). Nucleotide size and accession number of PATRR11 and PATRR22 allele types are listed. Arrows indicate each arm of the palindromic sequences. Red and Blue arrows indicate complementary strands.

