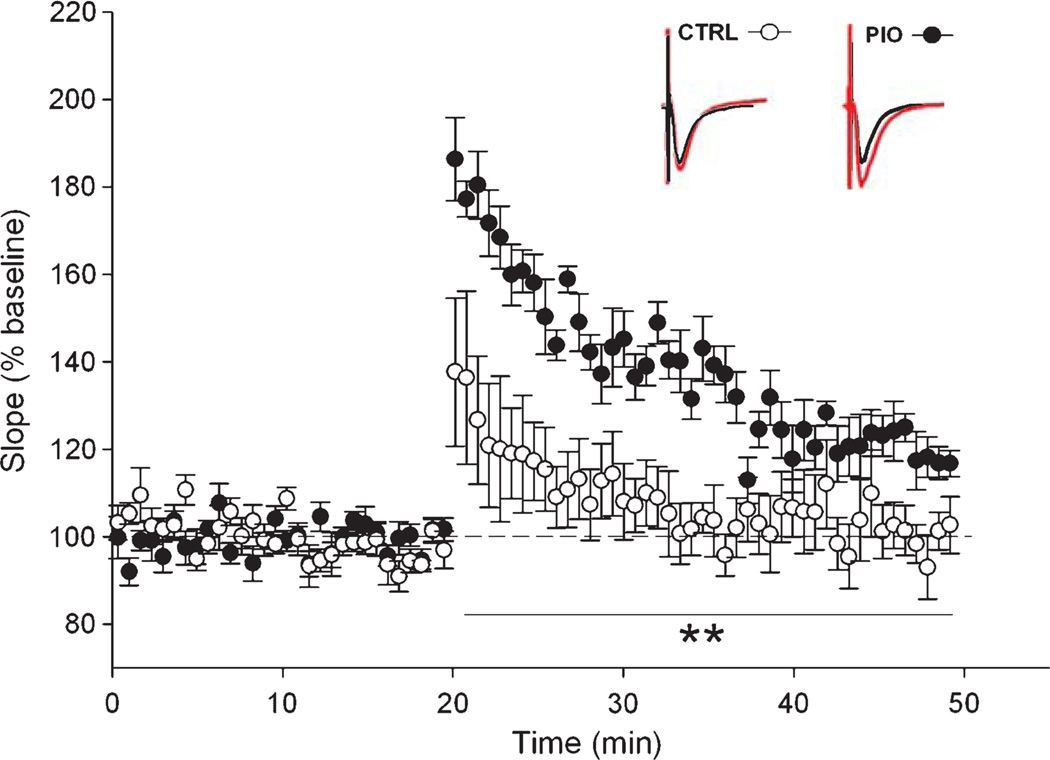
Fig. 5.
High frequency induced synaptic potentiation. Normalized EPSP slopes measured in CTRL (white circles) and PIO (black circles) fed animals during baseline and following a 1 s 100 Hz stimulation burst. All measures taken after LTP induction were significantly greater in the PIO group. Inserts represent EPSP traces taken before LTP induction (black), and in the last 5 minutes of recording (red). Data represent Mean ± SEM, **p < 0.01, RM-ANOVA.

