
Fig. 4.
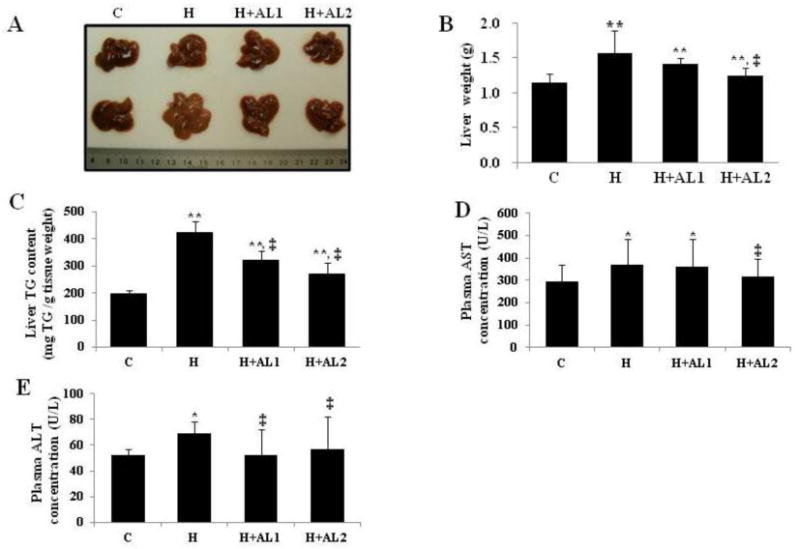
Effects of AL treatment on the liver weight, hepatic steatosis, and plasma ALT and AST concentrations. (A) Images of livers isolated from different groups, (B) Liver weights isolated from all experimental groups, (C) total liver TG concentration, (D) plasma AST concentrations, and (E) plasma ALT concentrations. Data are presented as mean ± S.D. (n = 5). * and **indicate that the differences among the control (C-mice) and experimental mice (H, H+AL1, or H+AL2 mice) were statistically significant at p < 0.05 (*) or p < 0.01 (**). ‡ denotes the significant differences among AL-untreated H group and AL treated groups (i.e. H vs. H+AL1 or H+AL2 mice group, p < 0.01).