Figure 2.
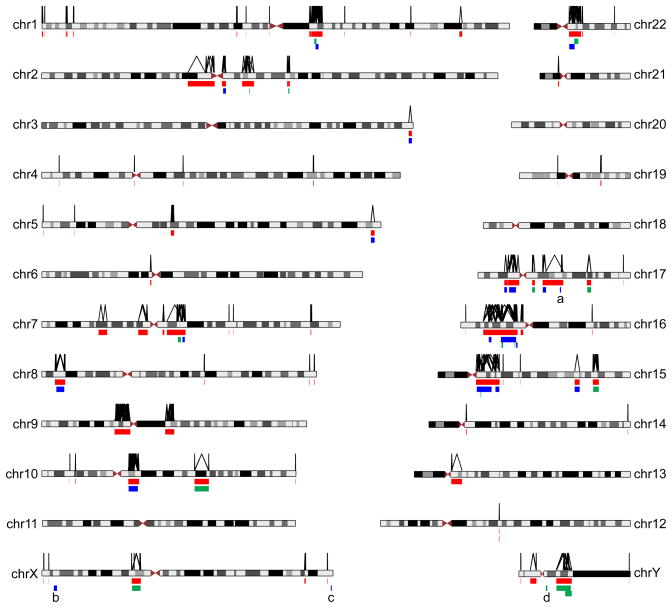
Genome-wide map of computationally predicted NAHR-prone regions and empirically verified NAHR-associated disease regions. LCR pairs fulfilling chosen criteria (> 10 kb in length, > 95% in identity, directly oriented, with intervening sequence between 50 kb and 10 Mb, not spanning the centromere) are considered as potential substrates for NAHR. They are linked by an inverted V-shaped line as illustrated above the chromosome ideograms. Genomic regions flanked by such lines are merged into non-redundant sites, and illustrated as the 89 red bars below the ideograms. Regions of known genomic disorders are shown as green (only deletion associated with disease) or blue (both deletion and duplication associated with disease) bars. a, the 17q21.31 rearrangement occurs on an alternative haplotype [73]. b, the Xp22.31 rearrangement was not predicted by the NAHR map because the flanking LCR substrate is ~ 9 kb in length (< 10 kb) [26,74]. c, the Xq28 rearrangement was not predicted by the NAHR map because the flanking LCR is ~ 9.5 kb in length (< 10 kb) [75]. d, the rearrangement involving AZFa [76] was not predicted by the NAHR map because the deletion is mediated by a pair of HERV repetitive elements.

