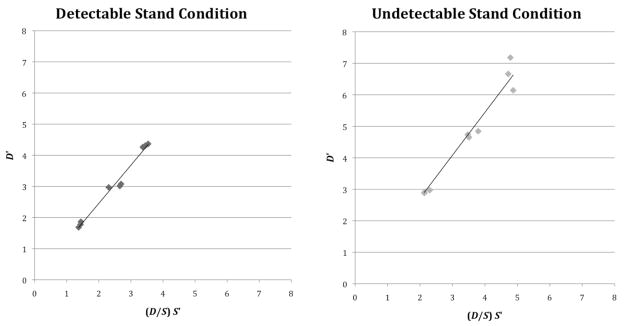
Figure 6.
Relationship between apparent size, S′, and apparent distance, D′, in Experiment 1. Each datapoint represents the average across all participants for each target size, at each target distance, for either the detectable or undetectable stands conditions. The horizontal axis shows , as in Equation 1. The lines show regression through the origin of the data values for each condition. All distances are with respect to the line-of-sight.

