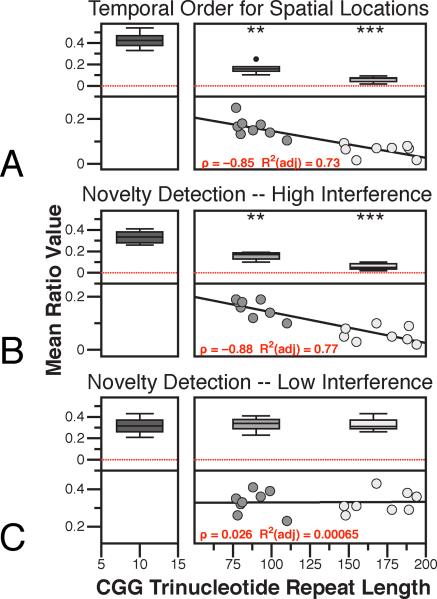
Figure 2.
Experimental Data. A. Temporal Ordering for Spatial Locations. B. Novelty Detection for Spatial Locations with High Spatial Interference. C. Novelty Detection for Spatial Locations with Low Spatial Interference. Boxplots represent the following groups: wildtype mice, Low CGG repeat mice with CGG repeats from 77–110 repeats, and High CGG repeat mice with 145–194 repeats. The scatterplots below the boxplots have the axes adjusted to emphasize the relationship between CGG repeat length and behavioral performance. As such, the wildtype mice are not shown. ** p<0.001; *** p<0.001

