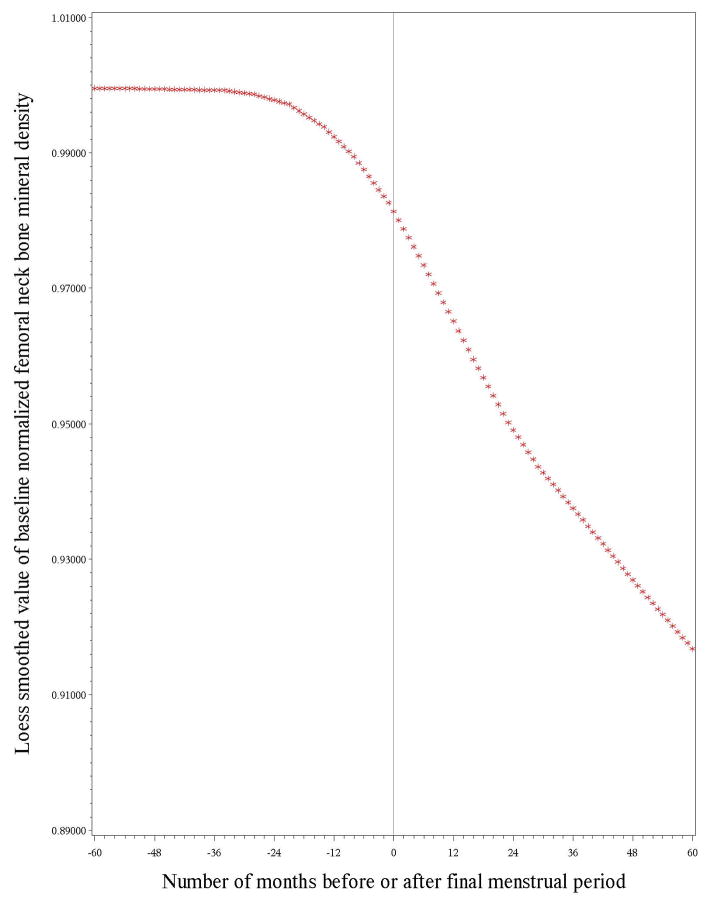
Figure 2.
presents the longitudinal trajectory of baseline-normalized femoral neck bone mineral density (BMD) values relative to time before or after the FMP (FMP [time zero]). The span between 5 years and 1 year before the FMP was characterized by no measurable drop in BMD. This loess plot illustrates no measurable decline in femoral neck BMD during the interval between 5 years and 1 year before the FMP, BMD loss starting 1 year prior to the FMP that continued for 2 years after the FMP, and a deceleration, but not cessation, of BMD loss 2 years after the FMP.

