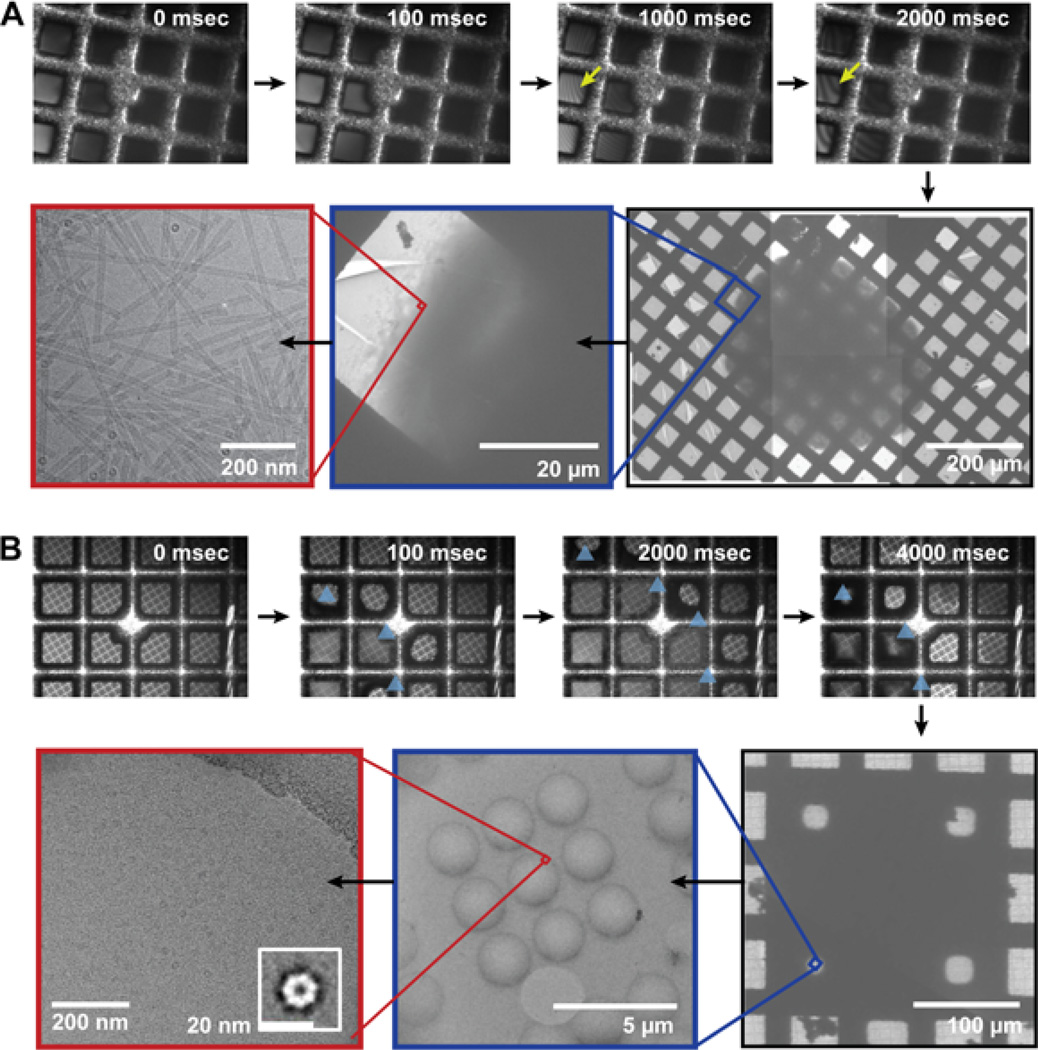
Figure 5. Inkjet dispensing, vitrification and cryo-TEM of specimens on EM grids.
A) Top panel: Inkjet dispense and vitrification of 1.6 nL (50 droplets) of Tobacco Mosaic Virus (TMV) onto continuous carbon grids and rear-view imaging of specimen drying profiles. Yellow arrows indicate onset of drying within specific regions and after specified time-points. Bottom panel: Cryo-TEM imaging of specimen prepared above at low (100×), medium (560×) and high magnification (52000×). B) Top panel: Inkjet dispense and vitrification of 3.2 nL (100 droplets) of GroEL onto holey carbon grids and rear-time imaging of specimen drying profiles. Blue arrows indicate edge profile of dispensed sample on the grid after specific time-points. Bottom panel: Cryo-TEM imaging of specimen prepared above at low (120×), medium (5000×) and high magnification (50000×). Inset represents a 2D class average of GroEL particles.

