
Figure 6.
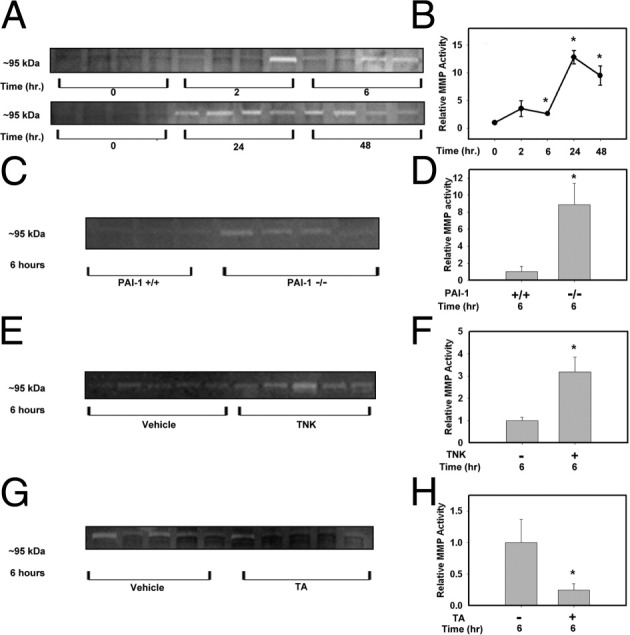
Role of plasminogen activators in MMP-9 activation in APAP-treated mice. Representative zymogram images (A, C, E, and G) and their respective zymogram quantification (B, D, F, and H) from liver homogenates of APAP-treated mice. A: Gelatinase activity was determined from homogenates of APAP-treated wild-type mice various times after APAP treatment. C–H: Gelatinase activity was determined at 6 hours in liver homogenates from PAI-1+⧸+ and PAI-1−⧸− mice(C and D), wild-type mice treated with TNK or vehicle (E and F), and wild-type mice treated with tranexamic acid (TA) or vehicle(G and H). Data are expressed as means ± SEM (B) or as means + SEM (D, F, and H). *P < 0.05 versus the respective control. n = 3 to 5 mice per group.