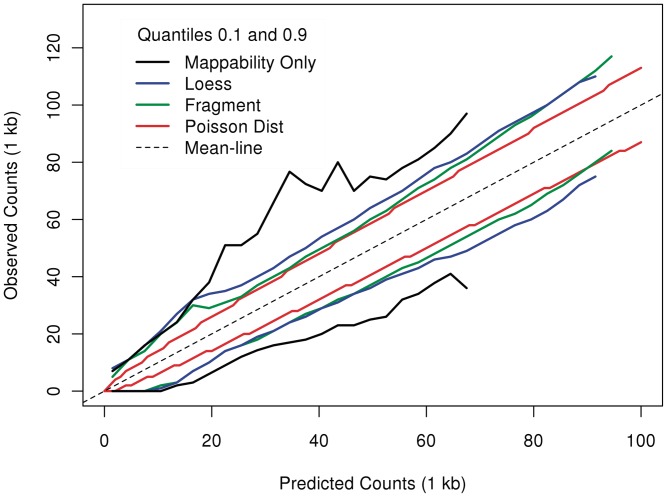
Figure 10.
Comparison to Poisson variation. 0.1 and 0.9 quantiles of observed counts grouped by estimated rates. Models that predict better will have narrower vertical spreads. Variation around the mean of the fragment model (green), the loess (blue) and mappability (black) are compared to variation around a Poisson (red).

