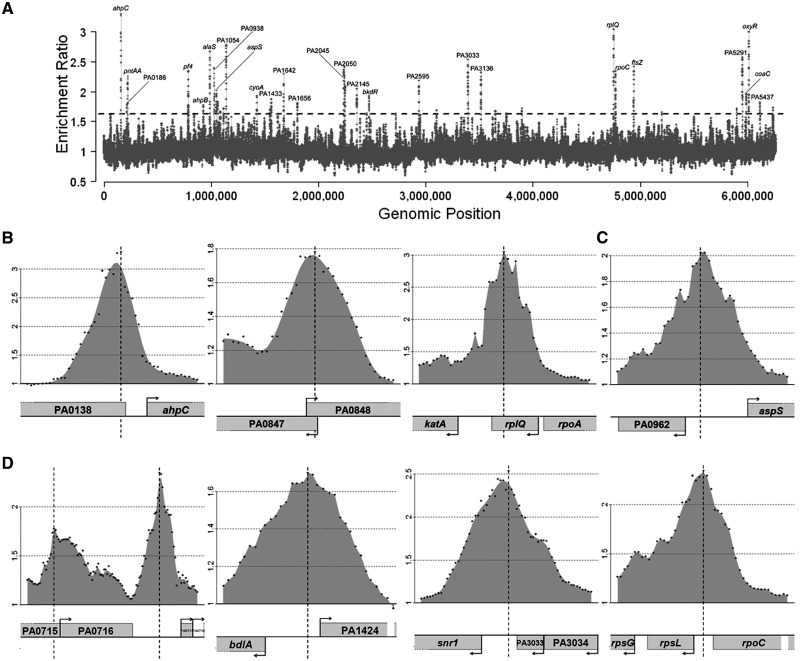
Figure 1.
Distribution of OxyR binding sites across the P. aeruginosa genome. (A) An overview of results from ChIP-chip experiments that measure the binding profiles of OxyR throughout the P. aeruginosa PAO1 chromosome during stationary growth phase in contact with 1 mM H2O2 for 10 min. Binding intensities (y-axis, log2 ratio) are plotted against their corresponding genomic locations on the chromosome (x-axis). The dashed threshold line of 1.6 (=20.7) is labeled. A complete list of all the targets can be seen from Supplementary Table S1. Some selected regions were also labeled in the graph. (B) The figure shows the known binding regions of OxyR in P. aeruginosa, PA0139 (ahpC), PA0848 (ahpB) and PA4236 (katA). (C) The figure displays OxyR binding to the previously identified potential OxyR targets in P. aeruginosa, PA0962 (dps). (D) The figure displays OxyR binding to some of the newly identified OxyR targets in P. aeruginosa, PA0717-0719 (pf4 bacteriophage genes), PA1423 (bdlA), PA3032 (snr1) and PA4268 (rpsL). Only partial results are listed here and all data can be found in Supplementary Table S1. Data shown in all panels are average values from replicates (P < 0.05). y-axis of (B), (C) and (D) shows log2 ratio number of binding intensities.

