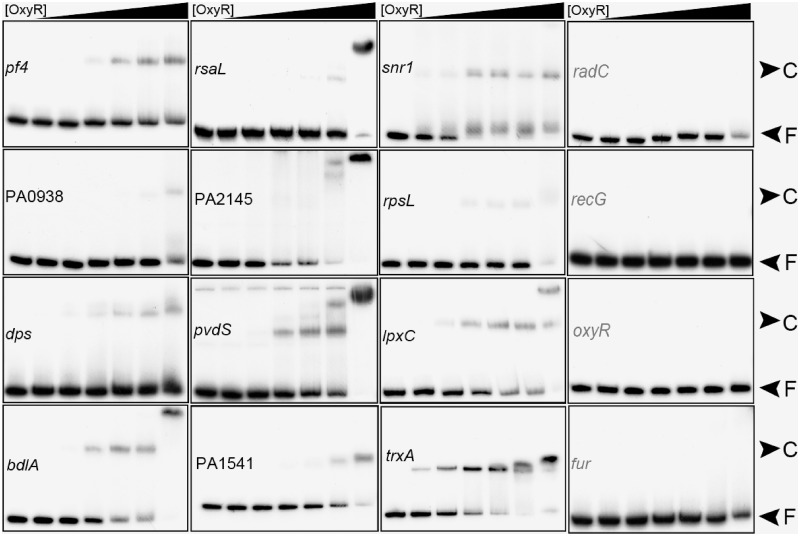
Figure 2.
Validation of binding of OxyR to selected target regions by EMSA. The promoter regions were chosen randomly and EMSA analyses are described in ‘Materials and Methods’ section. OxyR was purified in air conditions and used in the following concentration (from left to right) (nM): 0, 84, 168, 336, 504, 840 and 1680. Protein–DNA complex (C) and free DNA (F) are indicated. Promoter regions with positive binding results are shown in black while regions with negative results are highlighted in grey. Promoter region of fur was used as a negative control. Supplementary results using the positive control (ahpC) are shown in Supplementary Figure S3A.

