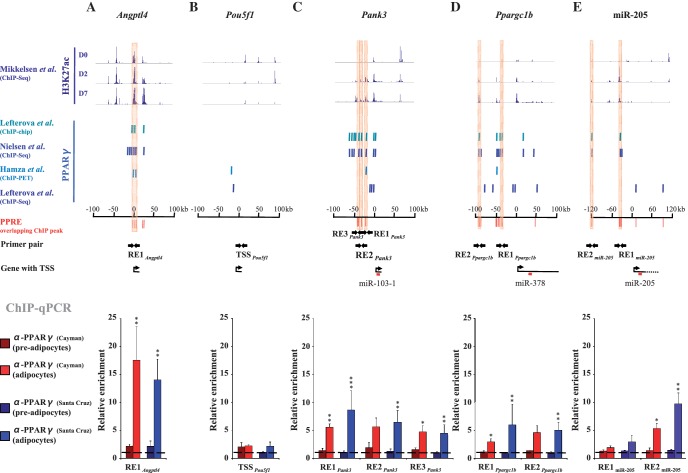
Figure 5.
Identification of active PPREs responsible for direct PPARγ–DNA interaction and validation of the PPARγ binding at the PPREs on the Pank3, Ppargc1b and miR-205 loci by ChIP analysis. (A–E, top panel) Levels of H3K27 acetylation determined by ChIP-Seq (7) at D0, D2 and D7 of 3T3-L1 differentiation and (A–E, middle panel) PPARγ-binding sites determined by ChIP-chip (3), ChIP-Seq (4,6) and ChIP-PET (5) ±100 kb around the TSS of (A) the Angptl4 positive control locus, (B) the Pou5f1 negative control locus, (C) Pank3 (miR-103-1), (D) Ppargc1b (miR-378) and (E) ±120 kb around the TSS of miR-205. In silico predicted PPREs overlapping with the ChIP binding sites are marked in red. The PPREs selected for validation are highlighted and the primers used to amplify regions overlapping these PPREs are indicated as arrows. (A–E, lower panel) ChIP analysis using two different PPARγ antibodies from independent providers [α-PPARγ (Cayman) or α-PPARγ (Santa-Cruz)] and IgG as a control. qPCR was performed with DNA immunoprecipitated from pre-adipocytes (D0) or adipocytes (D6) and using primers specific for (A) a known PPRE on the Angptl4 locus, (B) an unrelated control region on the Pou5f1 locus, (C) three putative PPREs (RE1Pank3, RE2Pank3 and RE3Pank3) on the Pank3 locus, (D) two clusters of putative PPREs (RE1Ppargc1b and RE2Ppargc1b) on the Ppargc1b locus and two putative PPREs (RE1miR205 and RE2 miR205) on the miR-205 locus. The measured enrichment values were normalized to 1:100 diluted input DNA. The enrichment of PPARγ is shown relative to the enrichment of IgG (indicated by dashed line). Data points indicate the mean enrichment values of at least three independent experiments and the error bars represent SEM. One sample t-test was performed to determine the significance of PPARγ enrichment at D6 compared with D0 (*P < 0.05; **P < 0.01; ***P < 0.001).

