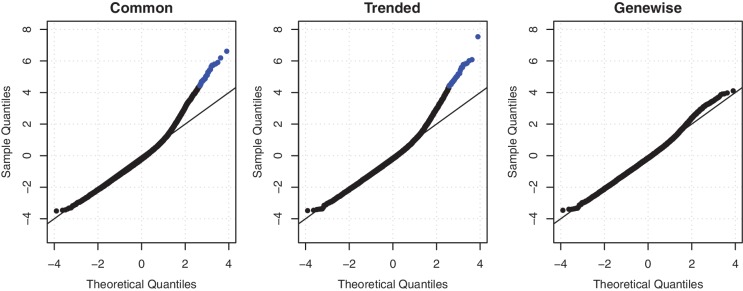
Figure 2.
QQ-plots of goodness of fit statistics using common, trended or empirical Bayes genewise (tagwise) dispersions. Genewise deviance statistics were transformed to normality, and plotted against theoretical normal quantiles. Points in blue are those genes with a significantly poor fit (Holm-adjusted P-value < 0.05). When using genewise dispersions, no genes show a significantly poor fit.

