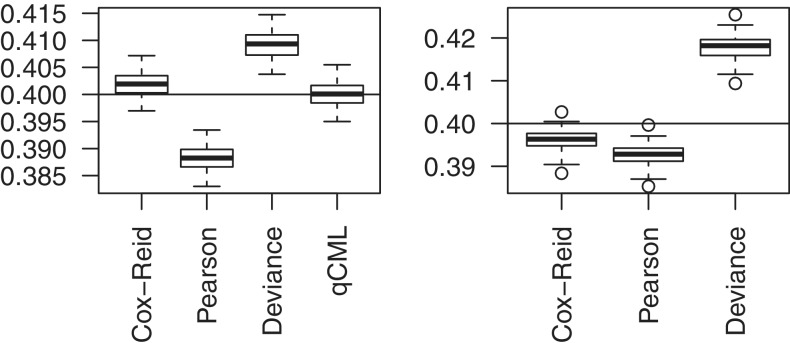
Figure 3.
Boxplots of common BCV estimates from 100 simulated data sets. The left panel shows results for the one group case, with three replicate samples in the group. The right panel shows results for a paired-design with two groups and three blocks. The horizontal lines indicate the true common BCV of 0.4, chosen to match with the carcinoma case study. Conditional maximum likelihood (qCML) is the most accurate in the former case. For generalized linear models, Cox–Reid APL is the best performer.

