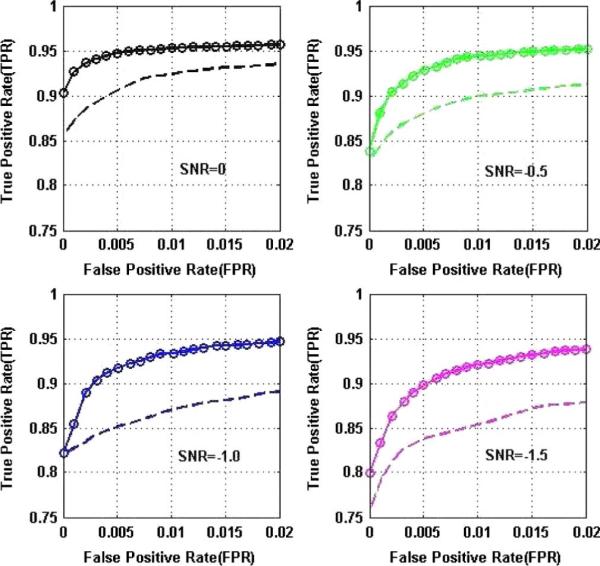
Fig. 4.

Comparison of ROC curves for our multiseed method (solid lines with circles) and the single-seed method (with spatial noise also considered, dashed lines) at different SNRs, showing significantly improved performance using multiple seeds. Note: The TPR and FPR for the single-seed case are computed as below: M is the total number of voxels; Let i = 1, 2 be the seed index. Suppose: ni (i = 1, 2) is the number of voxels correctly detected as significant; Ni (i = 1, 2) is the number of voxels with added type i connectivity; mi (i = 1, 2) is the number of voxels incorrectly detected as significant. Therefore, the combined TPR and FPR used in the ROC plots for the single-seed case are: TPR = (n1 + n2)/(N1 + N2) and FPR = (m1 + m2)/(M − N1 − N2)
