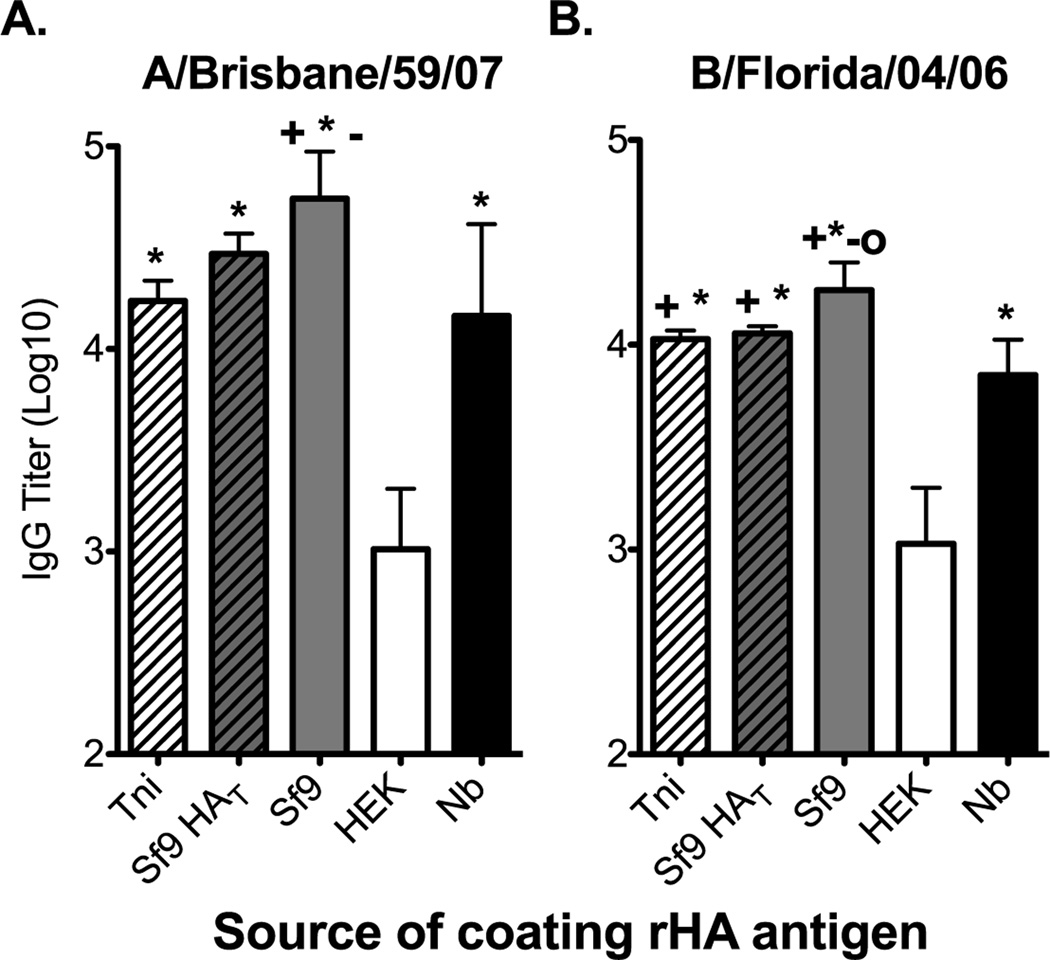
Figure 2. The rHA production process significantly affects its antigenicity in a mouse IgG ELISA assay.
B6 female mice were infected intranasally with 150,000 EID50 of (A) A/Brisbane/59/07 or (B) 5000 EID50 of B/Florida/04/06 and serum was harvested 21 days post infection. ELISA plates were coated overnight with equal concentrations of Tni (white hatched bars), Sf9 HAT (grey hatched bars), Sf9 (grey bars), HEK (white bars), or Nb (black bars) derived rHAs (0.05µg/well). Convalescent serum was diluted two-fold and added to the rHA-coated plates. IgG titer is defined as the highest dilution in which the optical density is greater than 3 times the average of an equally diluted negative (naïve) control. Mean IgG titer and standard deviation are presented on the graph. Mann-Whitney (t-test) statistical analysis performed with n=14/group (A) and n=9/group (B). Statistically significant comparisons against HEK (*), Nb(+), Tni (−), and Sf9 HAT (O) proteins are denoted by the corresponding symbols. The respective p-values for the statistically significant comparisons are as follows for panel A + = p<0.0213, * = p<0.0003, and − = p<0.004. For panel B + = p<0.0463, * = p<0.0004, − = p<0.0113, and O = p<0.0170.

