
Figure 3.
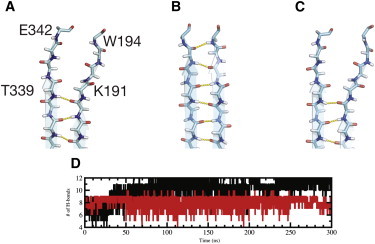
Interstrand H-bonds between strands s3A and s5A during simulations. Interstrand H-bonds between strands s3A and s5A of (A) crystal structure, and representative time-averaged structure (over the last 50 ns of simulation) of (B) wild-type and (C) E342K-mutated α1-AT. Differences in H-bond patterns can be seen, as wild-type α1-AT has H-bond interactions between T339 → G192, G192 → D341, and D341 → W194 that are formed during simulations. (D) Number of H-bonds between s3A and s5A main-chain atoms as a function of simulation time for wild-type and E342K-mutated α1-AT (black and red, respectively). The average number of H-bonds for the last 200 ns of the simulations between s3A and s5A is 10 ± 1 and 8 ± 1 for wild-type and E342K mutated α1-AT, respectively.