
Figure 4.
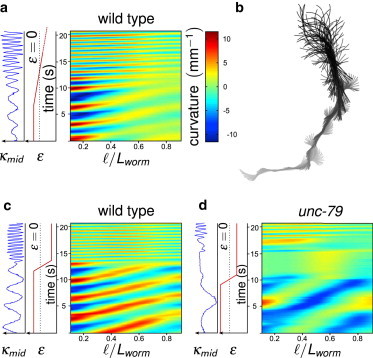
Dynamical variation of the confinement parameter ϵ. (a and b) Spatiotemporal dynamics of a WT individual progressively released (dϵ/dt = −0.07 s−1) from its initial confinement (ϵ = 0.41). (a) Spatiotemporal graph of the curvature and corresponding evolution of ϵ (red) and of the curvature at midbody κmid (blue). (b) Projection over time of the successive skeletonized shapes of a WT worm during its release, from crawling (gray) to swimming (black). (c and d) Spatiotemporal graphs of the curvature for a sudden release (dϵ/dt = −0.7 s−1) for WT (c) and unc-79 mutant (d).