
Figure 7.
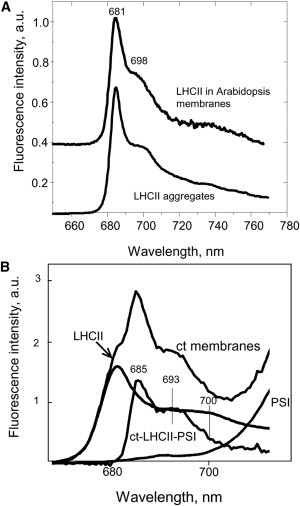
Low-temperature fluorescence spectral analysis of leaf homogenates. (A) Comparison between the fluorescence spectrums of treated leaf homogenate from which PSI spectrum was subtracted (upper curve) and the spectrum of aggregated LHCII with an average 2 ns lifetime. (B) The 77 K fluorescence spectra of control membranes (ct), aggregated LHCII with ∼2 ns fluorescence lifetime (LHCII), isolated PSI (PSI), and a difference ct-minus-LHCII-minus-PSI spectrum (ct-LHCII-PSI).