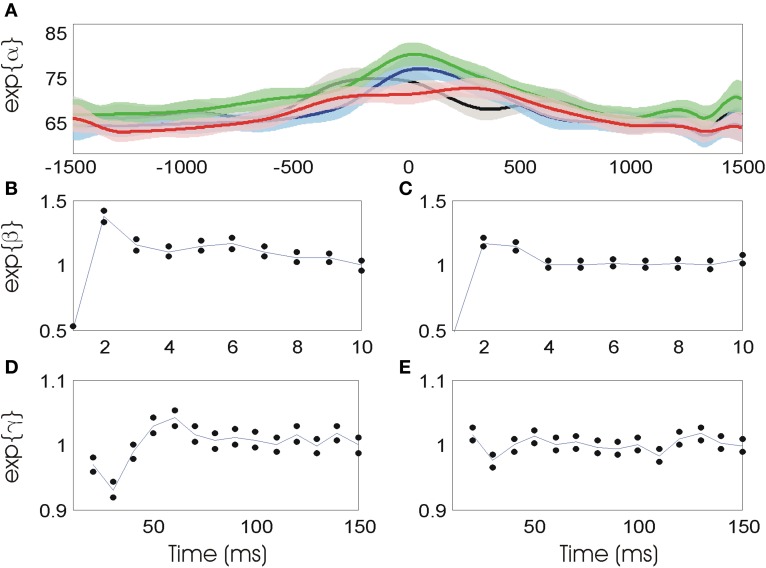
Figure 4.
(A) Stimulus related firing rate estimates in each of four movement directions (black—right; blue—down; green—left; red—up). (B) Short-term history (0–10 ms) parameters prior to movement. Blue line represents parameter estimates, black dots represent confidence intervals. (C) Short-term history parameters during movement. (D) Long-term history parameters (10–150 ms) prior to movement. (E) Long-term history parameters during movement.

