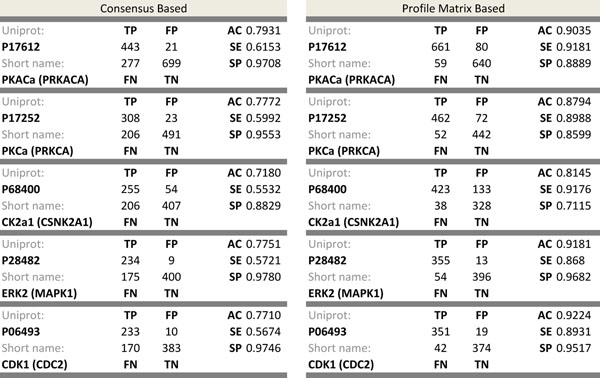
Figure 7.
Confusion matrices for two modules. The figure includes two tables and each table represents the classification power or consensus module (on the left) and profile matrix module of the predictor (on the right). In each table confusion matrix is represented by true positive (TP), false positive (FP), false negative (FN), and true negative (TN). Also accuracy (AC), sensitivity (SE), and specificity (SP) metrics are computed based upon the confusion matrices.

