
Fig. 3.
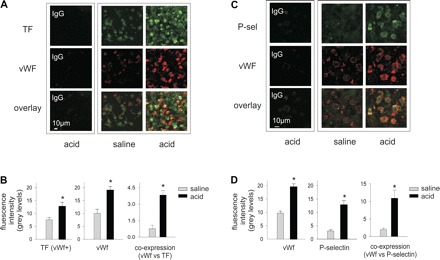
Confocal images of acid instillation-induced TF, vWf, and P-selectin (P-sel) colocalizations on lung endothelium. Images of pulmonary vascular cells freshly isolated from one mouse lung show protein expressions as indicated. Yellow in overlay indicates colocalization. Group data show fluorescence intensity and colocalization (coefficient for colocalization by LSM5 image examiner software). A: TF and vWf. B: group data for fluorescence intensity and colocalization, n = 4 mice each bar, 30 cells each mouse lung. C: vWf and P-selectin. D: group data for fluorescence intensity and colocalization, n = 4 mice each bar, 30 cells each mouse lung. Means ± SE, *P < 0.05 compared with saline.