Fig. 3.
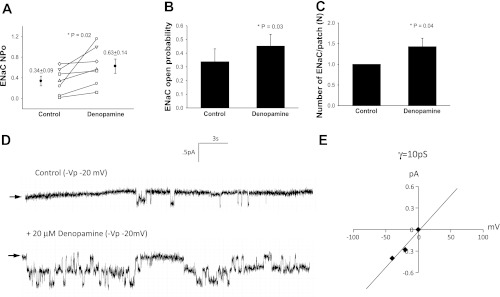
Denopamine increases NSC-ENaC in T1 cells. A: results for 7 independent observations shown on dot-plot graphs with y-axis = ENaC activity. NPo increased from 0.34 ± 0.09 to 0.63 ± 0.14 with stimulation by 20 μM denopamine; P = 0.02. B: results from 7 independent observations shown on bar graph with y-axis = ENaC open channel probability (Po). Treatment with 20 μM denopamine significantly increased Po of channels in T1 cells; P = 0.03. C: results from 7 independent observations shown on bar graph with y-axis = number of ENaC per patch. The number of ENaC increased significantly in T1 cells following denopamine challenge; P = 0.04. Asterisk denotes significant difference. D: representative recordings taken from a continuous cell-attached patch-clamp analysis of a T1 cell before (control) and after 20 μM denopamine treatment. Arrow indicates closed state, and downward deflections from closed state depict inward entry of Na ions. E: I/V curve of ENaC channels in T1 cells following denopamine treatment. Conductance measurements (γ = 10 pS) indicate the channels are mostly nonselective cation (NSC) channels.

