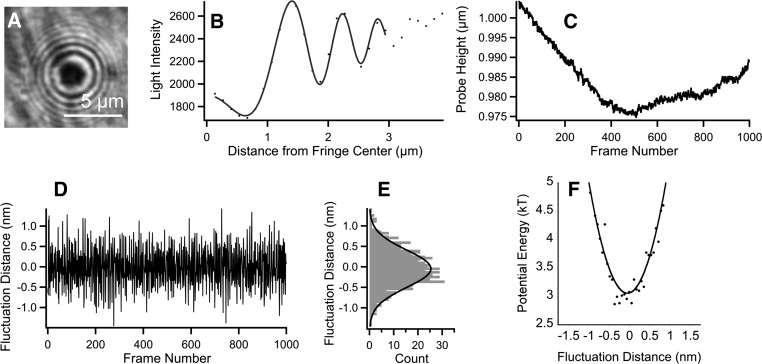
Fig. 2.
A: RICM image of a glass probe on a BLMVEC monolayer. B: radial intensity profile of a single RICM image frame: the first few fringes were fitted for each frame. C: changes in probe height during an RICM experiment shown as a function of the frame number. D: vertical distance fluctuations obtained from data in C after high-pass Hanning filtering. E: probability function, p(h), is shown as solid line, calculated from the histogram of distance fluctuations. F: potential energy profile U(h) calculated from p(h).

