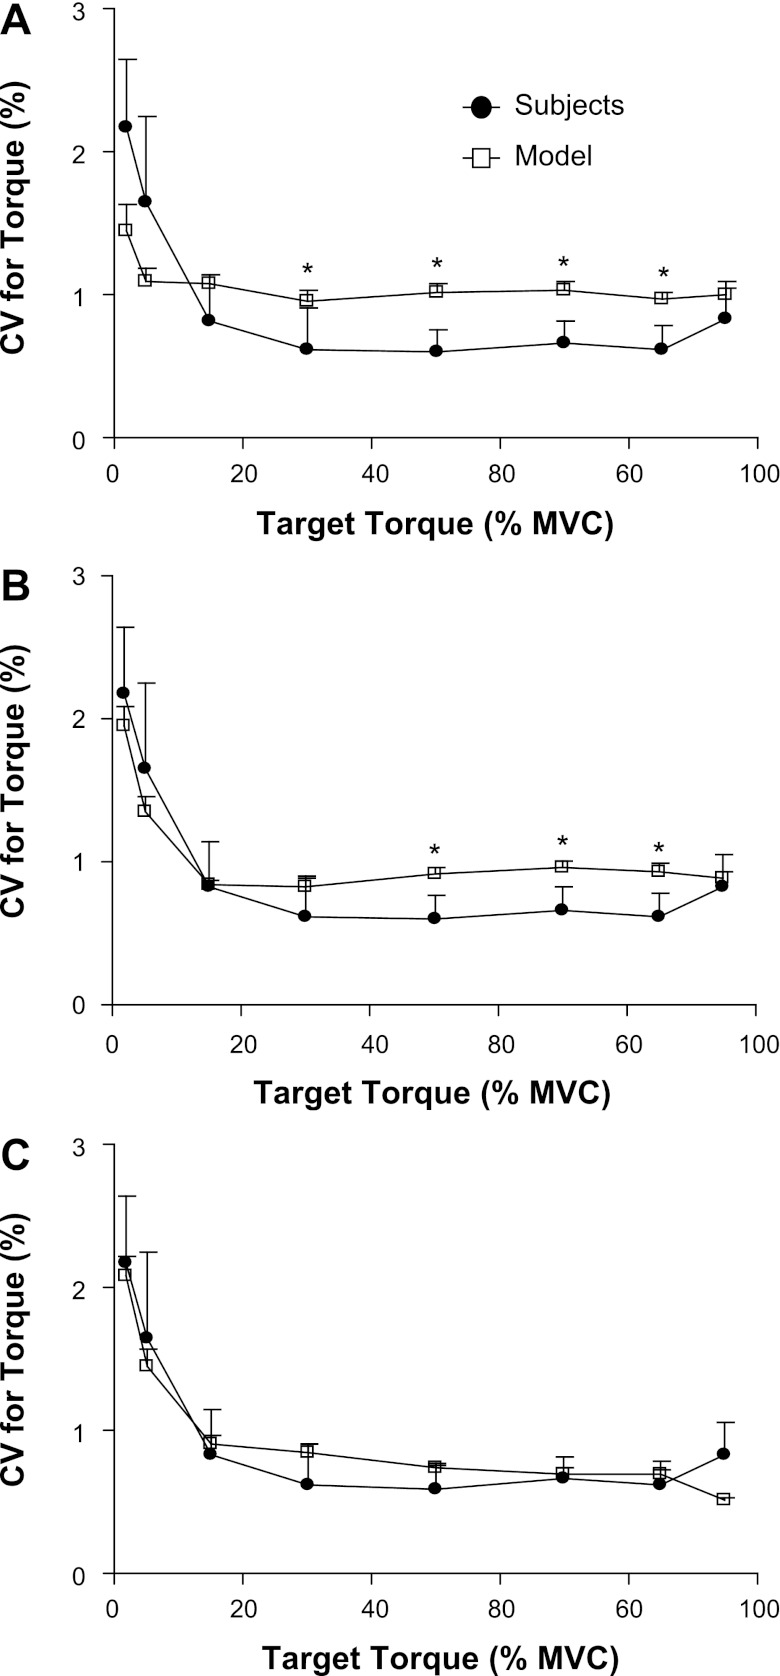
Fig. 5.
The measured and simulated CVs for dorsiflexion torque. Each panel represents the difference between the experimental measurements and 1 of the models of motor unit recruitment and rate coding for the tibialis anterior. A: the model reported by Moritz et al. (27) was revised to include an upper limit of motor unit recruitment at 80% MVC force and a minimal CVISI for motor units of 3%. B: the upper limit of motor unit recruitment was set at 85.7% MVC torque, the minimal CVISI was assigned to be 5%, and variability was added to the association between motor unit peak twitch torques and contraction times. C: the association between motor unit peak twitch torques and contraction times was changed to a linear relation (y = −0.11× + 50.5; R2 = 0.096; P < 0.001). Data are plotted as mean ± SE; *P ≤ 0.007 (modified Bonferroni) between the simulated and experimental measurement of CV for torque.

