
Figure 7. Tissue distribution of Spns2 mRNAs.
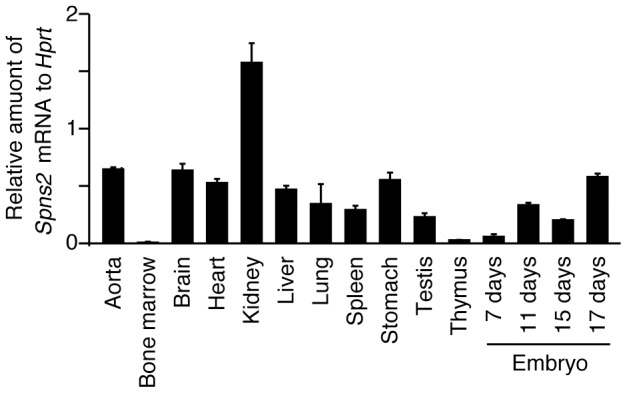
Quantitative real-time PCR was performed with first strand cDNA synthesized from mRNAs of various mouse tissues. The amount of Spns2 mRNA in each tissue is shown relative to that of Hprt. The primers and probes used for PCR are given in Table S2. The graph shows the average values from four experiments, with error bars representing the standard error.