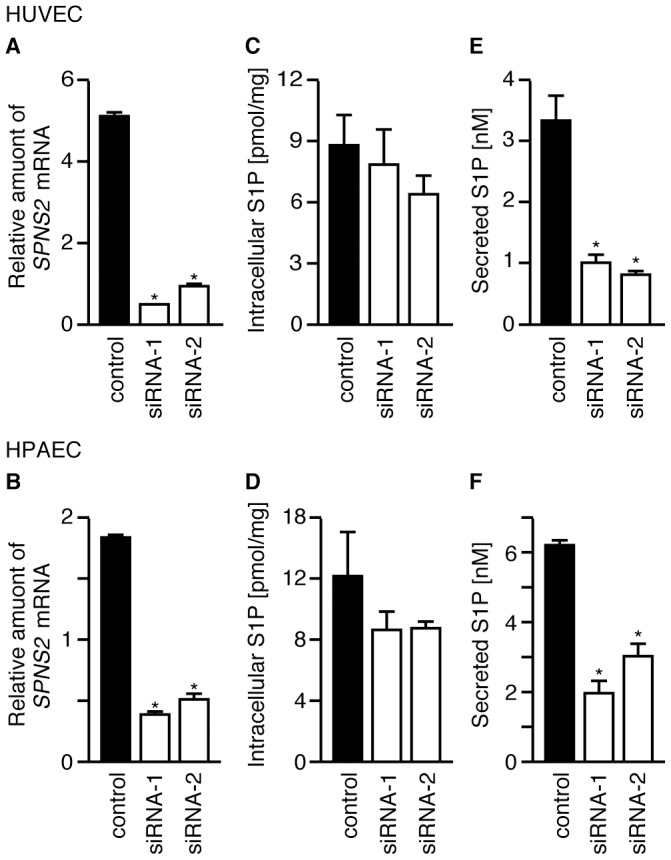
Figure 11. SPNS2 releases S1P from human vascular ECs.

HUVECs and HPAECs were treated with two siRNAs targeting SPNS2 mRNA or with a negative control siRNA. (A and B) Relative amount of SPNS2 mRNA in cells treated with siRNA. Total RNA was isolated, and SPNS2 and GAPDH mRNA levels were determined by quantitative real-time PCR. The amount of SPNS2 mRNA is normalized to GAPDH mRNA. (C and D) Intracellular S1P. (E and F) The cells were incubated with 1% BSA for 4 hr at 37 °C, and the released S1P was measured by UPLC-MS/MS. The cells were collected, and the intracellular S1P content was measured by HPLC. C17-S1P was used as the internal standard. The graphs show the average values from three (C and E) or four (A, B, D and F) experiments, with error bars representing the standard error. *P<0.005 compared to ‘control’.
