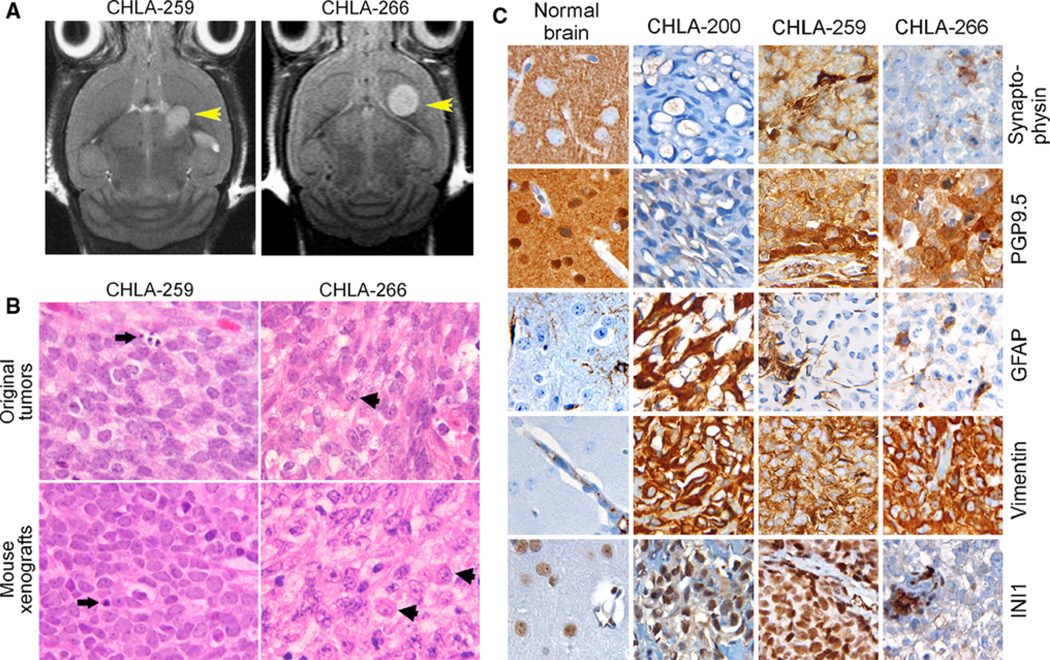
Fig. 5.
CHLA-259 and CHLA-266 form intracranial tumors in mice. a MRI images of tumors in mouse brains: Left panel CHLA-266, day 82, 2.1 × 2.0 mm tumor, Right panel CHLA-259, day 120, 1.9 × 2.4 mm tumor. b H&E stains of the original patient tumors (top panels) and the mouse brain tumors from orthotopic implantation of their respective cell lines (bottom). Original magnification is 4009. Arrows Apoptotic cells in CHLA-259, Arrowheads typical rhabdoid cells in CHLA-266. c Immunohistochemical staining for synaptophysin, PGP 9.5, GFAP, vimentin and INI1 of the mouse xenograft of CHLA-200 (subcutaneous), CHLA-266 and CHLA-259 (both intracranial) compared to normal brain

