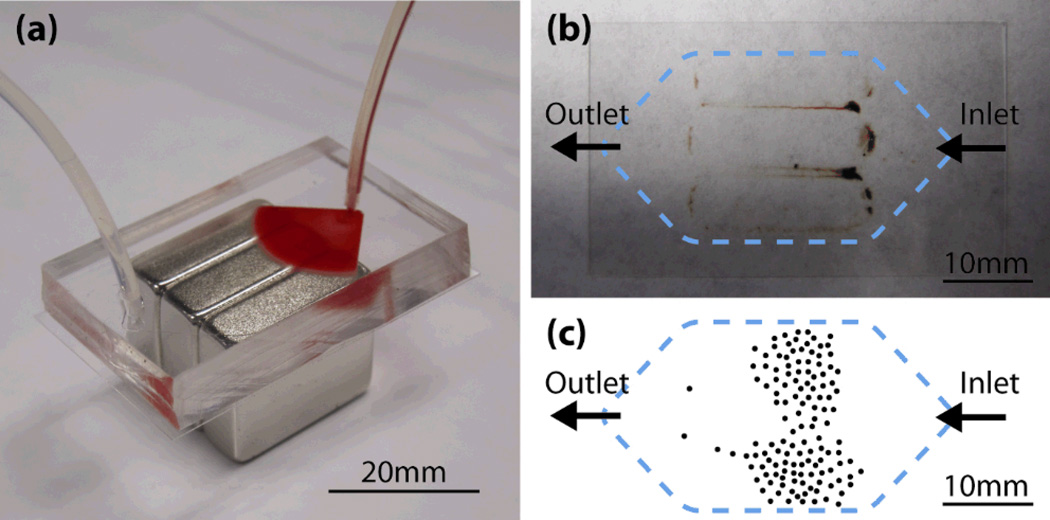
Fig. 5.
Blood screening experiment. (a) Photograph of the experimental setup. Blood sample is being introduced in the microchannel. (b) Bottom glass slide removed from the channel after screening. (c) Example of COLO205 cell distribution on the glass slide. The picture is a trace of a manually drawn sketch, approximating the coordinates of the cells.

