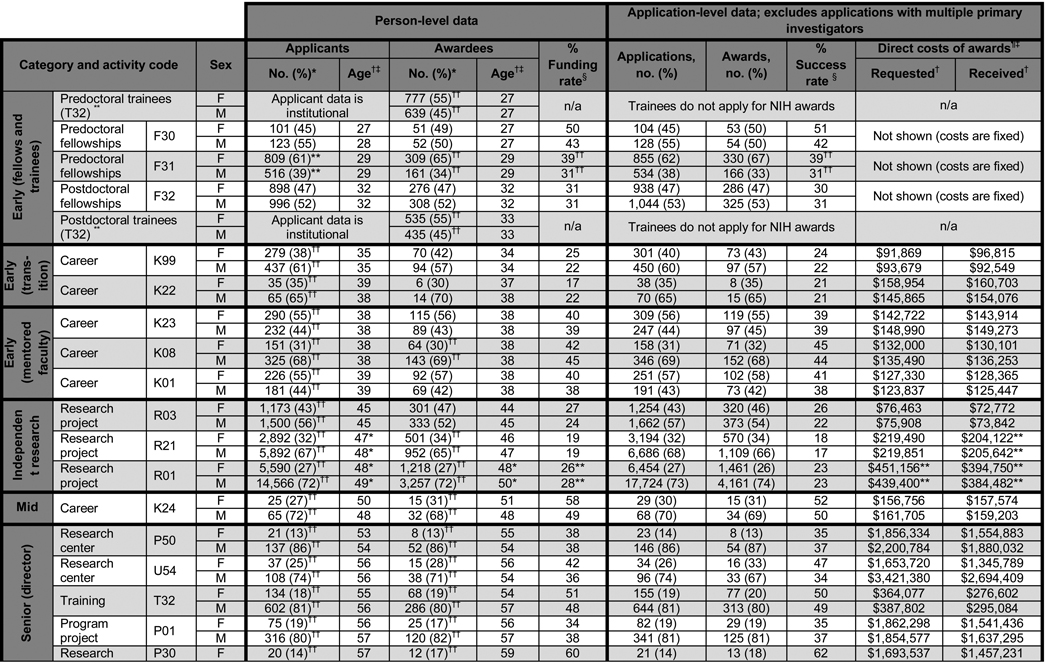
Chart 1.
Person-level and Application-level Data for Selected 2008 Competing National Institutes of Health Applications and Awards, by Activity Code (Award Mechanism) and Sex, in Order of Increasing Average Age within each Career Stage (Early – Independent – Mid – Senior)
* Binomial test was used to determine if the percentage of women or men in the applicant or awardee pool was different from 50%.
† Distribution comparisons between males and females were performed with the 2-sample Kolmogorov-Smirnov test.
‡ Values shown are averages.
§ Pearson’s chi-square test was used to assess sex differences.
¶ Applications with incomplete values for direct costs were excluded from cost calculations.
** Only full-time trainees appointed to FY2008 competing awards were included; trainees are not NIH awardees because the trainees are selected by the institution.
†† P<.05.


