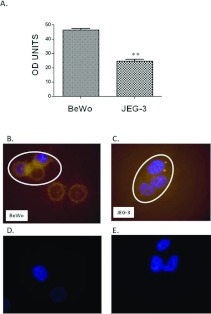
Figure 4. Down-regulation of DEPTOR protein in JEG-3 compared with BeWo cells.
(A) Densitometric analysis of DEPTOR revealed a notable up-regulation at the protein level in BeWo cells when compared with JEG-3, mirroring the changes seen at gene level using Q-PCR. (B and C) Immunofluorescent analysis of DEPTOR in BeWo and JEG-3 cells respectively revealed cytoplasmic localization in both cell lines. Circles in (B) and (C) indicate the same amount of cells used for densitometric analysis as in (A). Images were analysed using Image J 1.34s image-analysis software (**P<0.001). Results are presented as means±S.E.M. (D and E) Negative controls of (B and C) where the primary antibody has been omitted, demonstrating staining specificity.

