Figure 2.
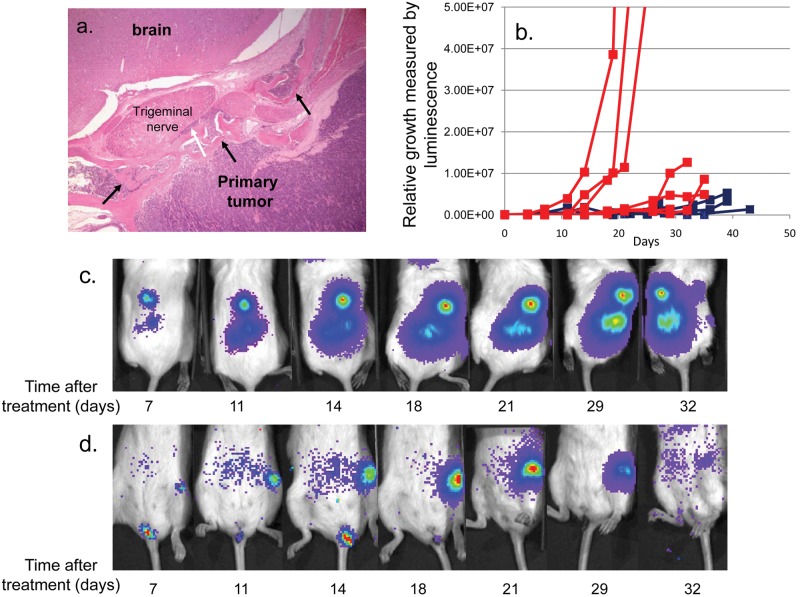
Sirolimus slows the growth of NPC metastasis. (A) H&E staining of a C666-1 primary-site tumor from a metastasis-bearing mouse that was treated with sirolimus and had regression of the metastatic tumor. Note bony invasion and remodeling (black arrows) as well as perineural invasion of the trigeminal nerve (white arrow). (B) Growth curves of multiple independent metastatic masses treated (blue, n = 7) or untreated (red, n = 6) with sirolimus immediately after tumors were detected, which was 18 ± 3 days after inoculation of tumor cells. Time 0 on the plot represents the time at which treatment with sirolimus or placebo was initiated. (C) A time series of viable animal scans, demonstrating growth of a metastatic tumor mass in the spine of a placebo-treated mouse, initiated 18 days after the inoculation of tumor cells. The time when scans were performed after the initiation of mock treatment is shown under each image. Note that the length of the scan varies according to the density of photon emission from the tumors, and therefore, the pictures cannot be used for quantitation of tumor growth. The actual quantitation derived from luciferase emission over time is shown in A. (D) As C, but for a mouse treated with sirolimus. Treatment was initiated 18 days after the inoculation of tumor cells. The x-axis indicates days after sirolimus treatment was started. Note that the mass has almost completely disappeared at the end of the time series.

