Figure 4.
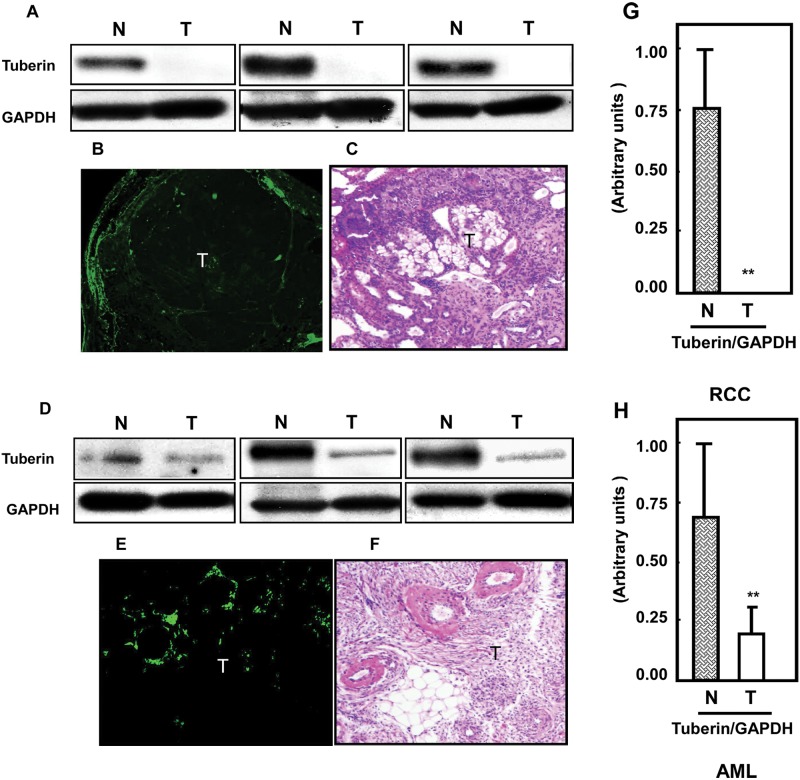
Loss of tuberin in kidney tumors of Eker rats compared to partial deficiency of tuberin in AML tissues. Tuberin protein expression was measured in (A) normal (N) and tumor (T) kidney tissues of rats and in (D) AML tissue homogenates by Western blot analysis. These sets of Western blots represent different samples from the normal and tumor kidney tissue of animals as well as from human kidney tissues. GAPDH was used as a loading control. Significant decrease in tuberin expression (B) was also shown in kidney tumor sections from Eker rats by immunohistochemistry. Partial expression of (E) tuberin was also detected in kidney sections of AML tissues by immunostaining. FITC for tuberin (green color) was detected with excitation wavelengths at 550 to 570 nm. H&E staining of kidney sections in rats and humans shows tumors versus normal adjacent tissues. (G, H) Histograms represent means of the normal and tumor samples of rats and humans ± SE. Significant difference from normal tissues is indicated by **P < 0.01.

