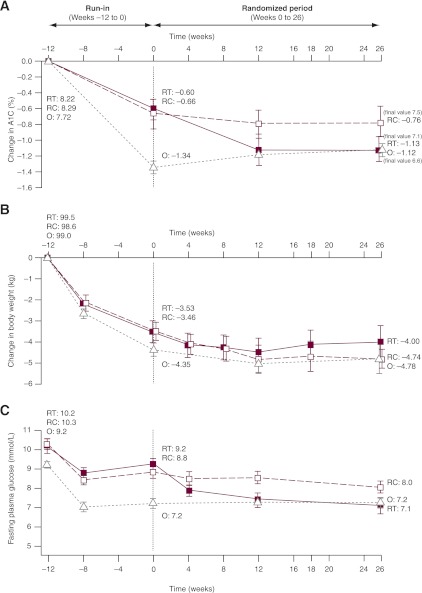
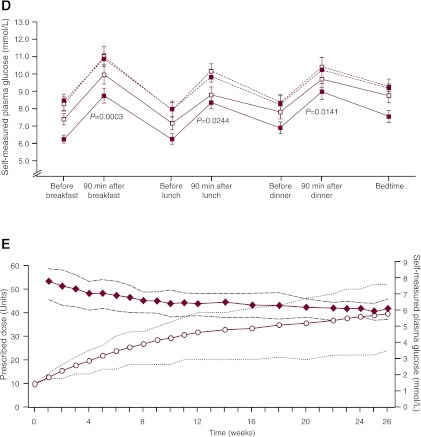
Figure 2.
Glycemic efficacy, changes in body weight, and insulin detemir doses. Results from run-in to randomization (vertical dotted line) and from randomization to the end of the trial for change in A1C (A), change in body weight (B), and mean FPG (C). Data are means ± 2 SE from the full analysis set with no imputation. RT, randomized treatment group; RC, randomized control group; O, observational group. D: Self-monitored plasma glucose profiles before and after breakfast, lunch, and dinner and at bedtime for the treatment and control groups at weeks 0 and 26. ■, randomized treatment group; □, randomized control group; △, observational group. Dotted lines, 0 weeks; solid lines, 26 weeks. Vertical bars indicate ± 2 SEM. P values refer to differences between groups in the change from randomization (week 0) to week 26. E: Insulin detemir dose (prescribed dose, ○, left ordinate) and self-measured FPG (♦, right ordinate) during the 26-week randomized period for the insulin detemir treatment group. Dotted lines indicate 25th–75th percentiles.


