
Figure 5.
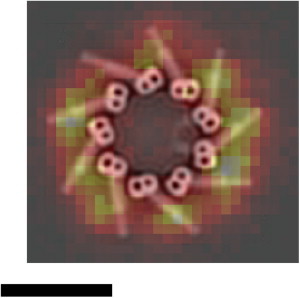
Representative STED image of Cep164 in an IMCD3 cell overlaid on the electron tomographic model of the mother centriole on the same scale (reprinted with permission from (21)), scale bar, 200 nm.
Official websites use .gov
A
.gov website belongs to an official
government organization in the United States.
Secure .gov websites use HTTPS
A lock (
) or https:// means you've safely
connected to the .gov website. Share sensitive
information only on official, secure websites.
Representative STED image of Cep164 in an IMCD3 cell overlaid on the electron tomographic model of the mother centriole on the same scale (reprinted with permission from (21)), scale bar, 200 nm.