
Figure 1.
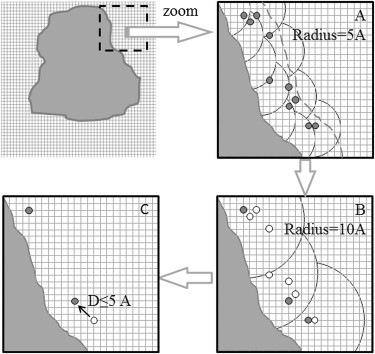
Schematic representation of the clustering algorithm. The left upper panel shows a protein mapped onto a grid. A small region (shown with dashed square) is zoomed and shown in panel A. Large circles symbolize the border of clusters, small open circles represent all points in a cluster, and solid dark circles represent points with the highest absolute potential. In panel A the radius of each cluster was 5 Å (the dashed line shows a cutoff distance of 5 Å away from the protein surface). (B) A more rigorous condition for cluster determination was applied (radius of clustering = 10 Å, and distance between the geometric average of all points in the cluster and farthest to its point in the cluster ≤5 Å. (C) The final step of clustering is to search for all resultant points <5 Å from each other and leave only those with greater absolute potential.